ETF Aristocrat’s MOAT of Midas Touch #6 +170% For The Ultimate Generational Wealth – Crushing the S&P 500


– Aristocrat’s ETF 7 Strong Pillars Together – Risk
By Harry Colt eltoromarketinsights+invest@substack
Hi fellow investors and welcome back for a Quant data driven analysis for the ultimate ETF. [Full Disclaimer]

Before I dive in don’t miss pre-black Friday this week-end only!

Read full story
Become a Premium Member Before BUY/SELLSignal Alerts Launch. Once launched Only NewLifetime Members will have acces to signals and a significant price increase! Not a member yet? Upgrade your game. All MOATs Of Midas Touch portfolios and Telegram Alerts!

The Power Dive Into Portfolio Performance Metrics

Monthly Returns Analysis (2014-2024)
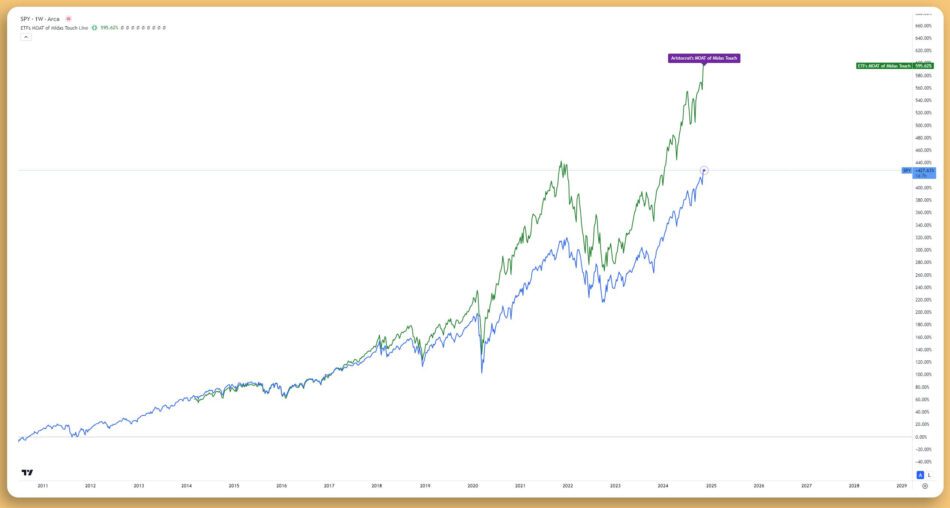
The historical monthly returns reveal fascinating patterns in our portfolio’s behavior. March 2020 marked our largest drawdown at -21.47%, followed by an explosive recovery of 19.53% in April 2020. The portfolio demonstrated remarkable resilience, with November 2023 delivering an exceptional 16.25% return. These monthly fluctuations underscore the portfolio’s ability to capture upside momentum while maintaining reasonable drawdown protection.


Who’s Behind Shield MMT Portfolio
Investment Intelligence is the brain behind the ETF Aristocrat’s MOAT of Midas Touch #6 Portfolio. Founded by experts with decades of experience in asset management and market analysis, their mission is clear: to add value for investors through insightful analysis, advanced tools, and well-curated portfolios. Our approach is independent and investor-focused, ensuring that the strategies align with long-term growth objectives.

Base Portfolio Performance (1x Leverage)

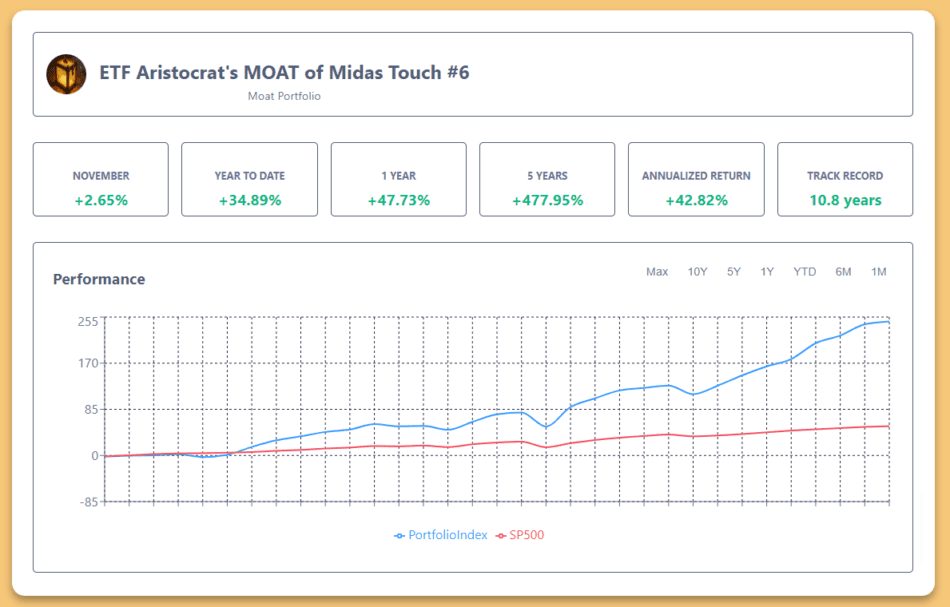
Starting from a modest $19,528 in 2014, our unleveraged portfolio has grown to an impressive $115,418, representing a 477.09% total return. Key growth phases include:
- Initial acceleration phase (2014-2017): Steady compounding with minimal drawdowns
- Momentum building (2018-2019): Successfully navigating market volatility
- Pandemic recovery (2020-2021): Capturing the full upside of market dislocation
- Recent surge (2022-2024): Demonstrating continued strength in a challenging environment

Enhanced Returns (2x Leverage)

The 2x leveraged version amplified our returns to 1841.25%, turning the initial investment into $288,250. Notable characteristics include:
- Doubled exposure increasing volatility but maintaining manageable risk levels
- Stronger recovery patterns during market rebounds
- Enhanced compound growth during bullish periods
- Strategic use of leverage maximizing return potential while controlling downside risk

Maximum Performance (3x Leverage)

Our most aggressive strategy, employing 3x leverage, generated a staggering 3499.59% return. This approach:
- Transformed the initial capital into $719,817
- Demonstrated the power of controlled leverage in bull markets
- Showcased remarkable recovery potential during market corrections
- Validated the portfolio’s robust construction through various market cycles

Post-2020 Performance Analysis
The portfolio’s resilience truly shined in the post-pandemic era:
- 1x Leverage: 193.63% return, demonstrating strong base performance
- 2x Leverage: 471.50% return, showing optimal risk-adjusted results
- 3x Leverage: 596.39% return, highlighting maximum potential in favorable conditions
The post-2020 performance validates our strategy’s effectiveness in both normal and extreme market conditions. Each leverage level offers a different risk-reward profile, allowing investors to choose based on their risk tolerance and investment objectives.
This validate our core thesis: thoughtful portfolio construction combined with strategic leverage can generate exceptional returns while maintaining reasonable risk parameters. Subscribe to my Substack for detailed monthly updates and in-depth analysis of our evolving strategy

Key Performance Metrics Deep Dive

Risk Metrics
- Beta: 1.15 indicating slightly higher market sensitivity than the S&P 500
- Jensen’s Alpha: Outstanding 42.82, demonstrating significant excess returns
- Calmar Ratio: Impressive 4.77, showing strong returns relative to maximum drawdown
Return Efficiency
- Sharpe Ratio: Excellent 2.84, indicating superior risk-adjusted returns
- Sortino Ratio: Exceptional 3.92, highlighting strong downside risk management
- Information Ratio: Strong 3.56, showing consistent outperformance
- Treynor Ratio: Solid 2.47, demonstrating efficient use of systematic risk
- Omega Ratio: Robust 3.56, confirming positive return probability distribution
Moat Portfolio Statistics

Core Metrics
- Type: Moat Portfolio (Strategic Advantage Focus)
- Investor Base: 3,531 active investors
- AUM Range: $11-15M+
- Risk Score: Conservative 4 out of 10

Curious about the specific holdings driving these outstanding returns? Want to know how these investments align with market trends and how you can apply these insights to your own portfolio?
Unlock the full analysis, including detailed holdings breakdown, performance over five years, and expert insights on maximizing your investment strategy with ETF Aristocrat’s MOAT of Midas Touch #6 Portfolio approach.
Want to know more? Join hundred thousands of Eltorians!

The Seven Pillars of Outperformance (premium only)
Let’s unravel the components of this powerhouse portfolio that’s been quietly compounding wealth.
The Anatomy of Alpha:
Breaking Down Our Market-Beating Portfolio.
Keep reading with a 7-day free trial
Subscribe to Eltoro Market Insights to keep reading this post and get 7 days of free access to the full post archives.
A subscription gets you:
| Quant Data Driven insight Analysis with our $200K+ worth AI tools |


